San Diego Parking Time Series
sandiego.gov-cityiq_parking-2 Last Update: 2019-02-20T04:10:31
15 minute interval parking utilization for 1600 parking zones in San Diego city.
This datasets is compiled from parking events scraped from the San Diego CityIQ smart streetmap system, via the cityiq Python package. The dataset is compiled from PKIN and PKOUT events between the dates of Sept 2018 and Feb 2019 for the whole SaN Diego system.
The dataset is heavily processed to eliminate duplicate events because there are many spurious events, but an excess of PKIN events. When computing the number of cars parked in all parking zones, the excess of PKIN events results in about 60,000 extra cars per month. These issues are explored in an Jupyter Notebook
The records in this dataset referece parking zones. More information, including geographic positions, are avialble in the CityIQ Objects dataset.
Processing
These data were produced with these programs:
$ pip install cityiq
$ ciq_config -w
$ # Edit .cityiq-config.yaml with client-id and secret
# Scrape PKIN and PKOUT from Sept 2018 to present
$ $ ciq_events -s -e PKIN -e PKOUT -t 20190901
# Split event dump in to event-location csv files
$ ciq_events -S
# Deduplicate and normalize
$ ciq_events -n
The last step, deduplication and normalization, involves these steps:
- Group events by event type, location and 1 second period and select only 1 record from each group
- Collect runs of a events of one type and select only the first record of the run, up to a run of 4 minutes long
- For each location, compute the cumulative sum of in and outs ( calculating the number of cars in the zone ) then create a rolling 2-day average. Subtract off the average.
The third step is demonstrated in this image:
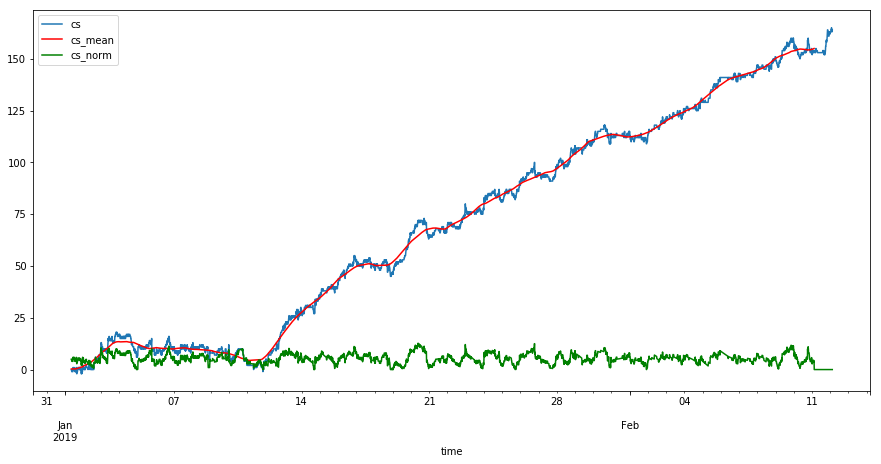
The blue line is the original utilization for a single location, showing the larger number of PKIN events than PKOUT events. The red line is the 2-day rolling average, and the green line is after subtracting the 2-dat rolling average.
In the final dataset, the data for the blue line is in the cs column, which is created from the cumulative sum of the delta column. The green line is the data in the cs_norm column, which is differentiated to create the delta_normcolumn.
For most purpuses you should use cs_norm and delta_norm.
Contacts
- Wrangler Eric Busboom, Civic Knowledge
Resources
- parking_events. Parking events
References
- parking_events. Parking events
- assets. Data package with metadata about the parking zone locations.
- locations. Data package with metadata about the parking zone locations.